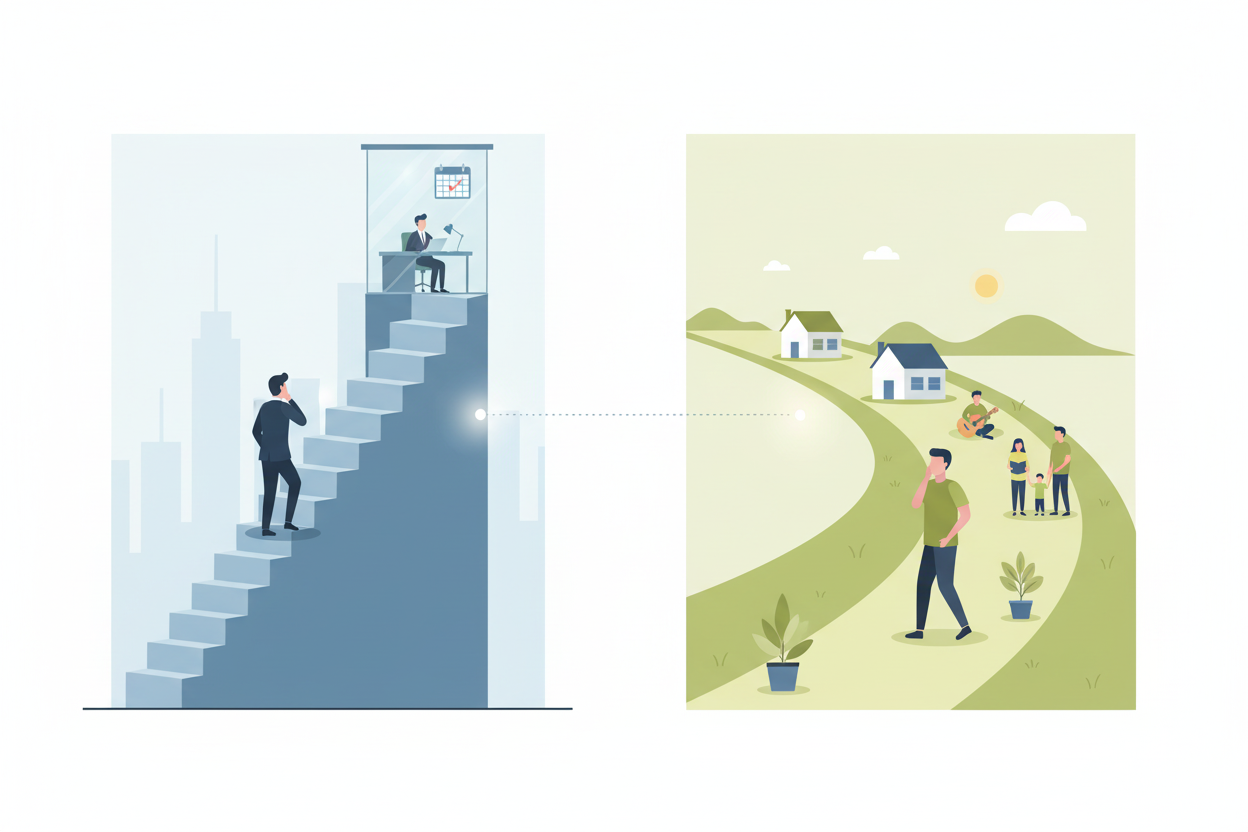
In other industries, there are other forms of experiments / tests (e.g. clinical experiments in biostatistics). We will focus on A/B test in tech industry for this class
Observational study v.s. Randomized experiment
● Observational studies can suggest good experiments to run, but can’t definitively show causality.
Randomization can eliminate correlation between X1 and Y due to a different cause X2(confounder)
Design randomized experiments
● Define the causal relationship to be explored, X -> Y
○ New UI decreases user interaction
● Define metric (Y). 1point3acres
○ Number of posts per user per day
● Design randomized experiments (A/B test) . 1point 3acres ○ Two groups of users, comparable
○ control group: old UI, experiment group: new UI
● Collect data and conduct hypothesis testing
○ Compare the metrics using two sample t test
Draw conclusion
Hypothesis testing
● Definition
○ Use sample of data to test an assumption regarding a population
parameter, which could be
■ A population mean μ. 1point3acres.com
■ The difference in two population means, μ1−μ2
■ A population variance
■ The ratio of two population variances
■ A population proportion p
■ The difference in two population proportions, p1−p2. 1point 3acres
. 1point3acres.com
Hypothesis testing (cont’d). check 1point3acres for more.
● Definition
○ Two opposing hypotheses about a population
■ Null hypothesis, H0 , is usually the hypothesis that sample ..
observations result purely from chance.
■ Alternative hypothesis, H1 or Ha, is the hypothesis that.
sample observations are influenced by some non-random
cause. check 1point3acres for more.
One sample v.s. Two sample tests
● One sample test
○ One population, compare test statistic, e.g, sample mean, with a
known number
● Two sample test
○ Two populations, compare two population means
○ Paired test.--
■ Two dependent groups, for example, same group been
measured at two different times.
■ Essentially one sample test
○ Unpaired test
■ Two independent groups, may have different sample sizes
Assumptions of t test
● Student t test
○ Normality
○ Independence
○ Equal variance (two sample test).google и
● What if normality is violated
○ Just do it (CLT)
○ Transformation
○ Other nonparametric methods. .и
.1point3acres
Process of A/B Test
Design . 1point3acres.com ● Understand Problem & Objectives
● Come Up with Hypothesis. Χ
● Design of Experiment
● Implement
● Code change & Testing. check 1point3acres for more.
● Run Experiment & Monitor
● Measurement
● Result Measurement
● Data Analysis
● Decision Making. 1point 3acres
. ----
DS306 数据科学面试 - AB Test专题
Process of A/B Test
Design of Experiment
Outline.google и
○ Key Assumptions
○ Assignment
○ Metrics
○ Exposure & Duration
Sample Size Calculation
Design of Experiment (DOE)
• The factor to test is the only reason for difference
• All other factors are comparable
• A unit been assigned to A or B is random
• Each experiment unit are independent
Principles of Experiment Design
• Independent samples
• Block what you can control. check 1point3acres for more.
Randomize what you can not control
DOE - Key Assumptions
DOE - Assignment Unit
How to decide which version to display to whom?
What is the unit to split A/B?
User_id? Cookie_id? Device_id? Session_id?IP address? etc.1point3acres
DOE - Assignment Unit
Considerations
○ What are the eligible subjects we try to influence
○ Example 1: Pop up promotion ‘15% off if register today’
○ Example 2: Send emails with ‘new dress arrivals’
○ What is the objective
○ Example 1: Remove homepage animation to reduce loading time
○ Example 2: Change button color to have more users to click
○ Example 3: Test impact of a change in ETA calculation method on trip cancellation rate.
Rider_id, driver_id, trip_id?. Waral dи,
○ Example 4: Test impact of a change in ETA calculation method on user retention rate. Rider_id,
driver_id, trip_id?
○ Independence & User experience
○ Example 1: Change homepage design in an app
Example 2: Add new video chat filters
DOE - Assignment Unit
In Practice, assignment unit
○ Default is user_id
○ Sometimes there is not only one right answer. Have to make a decision but aware of the pros & cons
Split % - % of Users in test / control
○ Most common 50/50 split
○ Sometimes not
Time sensitive e.g. holiday marketing campaign
.1point3acres
DOE - Assignment Unit
• Randomly assigned
• Test / Control % is as designed
• One unit only in one group
All other factors are comparable
How to Check?. ----
DOE – A/A Test. ----
A/A Test: use A/B test framework to test two identical versions against each other.
There should be no difference between the two groups.
The goal:
• Make sure the framework been used is correct
Data exploration & parameter estimation (e.g. sample variance)
. 1point 3acres
.
DOE – Assignment Common Problems
Your colleague gave you two dataset and told you they are
test/control groups from an A/B test. What will you do to make sure
the datasets are appropriate to use?
What will you do if you find users been assigned to both test and
control group? Do you have any concern?
DOE - Metrics
We need metrics!
Metrics should be set before experiment start
• Understand what kind of changes your experiment would cause
• Usually multiple changes happen the same time
• Trade-offs
• Understand what are the metrics worth monitoring
• Understand the importance of these metrics
Set expectation how these metrics would change
DOE - Metrics
What are the potential positive & negative impact of following experiments?. Waral dи,
○ Example 1: Remove homepage animation to reduce loading time
○ Example 2: Change button color to have more users to click
○ Example 3: Use real time traffic data to make ETA calculation more accurate to increase
matching efficiency.
Example 4: Add new video chat filters to increase user engagement
DOE - Metrics. From 1point 3acres bbs
Set key evaluation metrics
• That is what you use to make a decision
• Usually one or a few
• Sometimes use a comprehensive evaluation metrics (e.g. weighted average of
three metrics). 1point 3 acres
Other metrics worth monitoring
• Avoid unwanted negative impact
• Understand change in other metrics.
DOE - Metrics-baidu 1point3acres
What metrics are you going to evaluate the success of
digital ads? How to convince clients to buy ads on our
website?.google и
DOE – Exposure & Duration
In practice, we want to minimize the exposure and duration of an A/B test, because
• Optimize business performance as much as possible. 1point 3acres
• Potential negative user experience
• Inconsistent user experience.--
Expensive to maintain multiple versions
DOE – Exposure & Duration
How to decide exposure %?
• Size of eligible population
• Potential impact
• User experience
• Business impact
• Easy to test & debug?. check 1point3acres for more.
○ Example 1: Redesign the layout of your app. May significantly
change user behavior. Needs three teams of engineers to. 1point 3acres
coordinate
○ Example 2: Change button color to have more users to click.
Need one engineer 10 mins to make a change
How to decide duration?. 1point3acres
• Minimum sample size
• Daily volume & exposure %
Seasonality (at least one seasonal period)
. Χ
. Waral dи,
.
Sample Size Calculation. ----
Need to Estimate:
• Variance - estimate with sample variance
• Difference – opportunity sizing
• Observational data
• Qualitative result (e.g. survey, small scale test)
• Intuition & Practical consideration (e.g. minimum effect worthing implement
the change)
.
. 1point3acres
.
Implementation
Why calculate sample size?
Can we just let the experiment run until the result is
statistically significant?
.--
DOE – Peeking
No! Highly increase false positive rate
.1point3acres
Monitor key metrics while experiment running
• Should NOT frequently check result
• Should NOT stop once result turns significant
• Wait until get minimum sample size from experiment design
But need to monitor for alarming changes. Pause and investigate if needed
DOE – Monitoring
1. What if it takes too long to get desired sample size?
• Increase exposure
• Reduce variance to reduce required sample size
• Blocking – run experiment within sub-groups
Propensity Score Matching.
Example:. 1point3acres
We want to test the impact of a product change on ads’ click through rate.
We know there are users who are more clicky and have higher CTR in general and users
who almost never click on an ad. Is it fair to compare all users directly?
DOE – Problems & Solutions
Propensity Score Matching
Procedure
1. Run a model to predict Y (CTR rate) with appropriate covariates
Obtain propensity score: predicted y_hat.
2. Check that propensity score is balanced across test and control groups
3. Match each test unit to one or more controls on propensity score:
• Nearest neighbor matching.google и
• Matching with certain width
4. Run experiment on matched samples
5. Conduct post experiment analysis on matched samples
Propensity Score Matching
2. What if your data is highly skewed or statistics is hard to approximate with CLT?
Example:.google и
1. Metrics like revenue is highly skewed & have outliers
2. In risk/fraud, most transactions have no loss while some fraud transactions have very high loss
Solutions
• Transformation (hard to interpret). From 1point 3acres bbs
• Winsorization / Capping-baidu 1point3acres
• Bootstrap
Bootstrap
Bootstrap is a resampling method. It can be used to estimate sampling distribution of any statistics, commonly used in estimating CI & p-value & statistics with complex or no close-form estimator
Procedure
1. Randomly generate a sample of size n with replacement from the original data.
n is the # of observations in original data
2. Repeat step 1 many times. From 1point 3acres bbs
3. Estimate statistics with sampling statistics of the generated samples. From 1point 3acres bbs
Practice:
Use R to generate a 100 sample from Normal(3, 5).
Calculate it’s theoretical & bootstrap estimate of mean & variance
Bootstrap.google и
Pros
● No assumptions on distribution of original data
● Simple to implement .. ● Can be used for all kinds of statistics
Cons
Computational expensive
.
Result Measurement
Data Exploration.google и
○ Imbalance Assignment
○ Mixed Assignment
○ Sanity Check
Hypothesis Test
○ Conduct test
○ Multiple Testing. Χ
Result Analysis
○ Pre-bias Adjustment
○ Analysis unit different with Assignment Unit
Cohort Analysis
. .и
Result Measurement
Data Exploration. From 1point 3acres bbs
○ Check for % of test/control units. Is the % matching DOE?
IF not match, need to figure out what’s the cause
○Check for mixed assignment
○ It’s hard to resolve. If # of mixed samples is small, OK to remove. If big, need to figure out what’s the cause
What’s the problem of throwing away mixed samples?
.--
○ Sanity Check.
○ Are test/control similar in other factors other than treatment?
RM – Data Exploration.
Set up the right test. check 1point3acres for more.
○ Mostly use T-test
○ When variance is known is large, can use Z-test
○ When sample size small can use non-parametric methods.
For complicated statistics, can use bootstrap to calculate p-value
RM – Hypothesis Test
If all metrics move positively
○ Meet expectations? Yes, ready to launch
○ Be cautious if result is too good. May need to investigate (e.g. outliers)
If some metrics move negatively
○ Are they as expected? Are these metrics important?. 1point3acres
○ Deep dive to find causes. From 1point 3acres bbs
○If results are neutral
○ Slice / Dice on sub-groups 掷骰游戏; 掷骰赌博;
RM – Interview Question
○ What if your result show positive impact on some metrics and
negative impact on some other metrics?
○ What if your result is neutral?
○ What if you result is statistically significant but the margin is very
small?
○ Take home challenge
Multiple Testing
What if you have multiple test groups?
False positive rate is much higher when doing multiple testings!!
Need to control family-wise false positive rate
.
. Waral dи,
.google и
. 1point3acres.com
. 1point 3acres
Different Methods:. ----
Epsilon-Greedy: the rates of exploration and exploitation are fixed. Waral dи,
Upper Confidence Bound: the rates of exploration and exploitation are dynamically updated with respect to the rewards of each arm
Thompson sampling: the rates of exploration and exploitation are dynamically updated with respect to the entire probability distribution of each arm
Limitations of A/B Test
• Highly rely on your hypothesis
• Good for optimize small changes, Not good for innovative changes, long term strategies
• Other factors involved: e.g. learning effect, network effect
Other ways to make product improvement
• Qualitative Studies – Survey, focus group.1point3acres
Observational studies
How are A/B test questions asked?.1point3acres
• Asked directly
• Asked in case studies / product sense questions (Most common)
Asked in take home projects
Example Question 1
Survey showed teenagers are less engaged with Facebook after their parents join FB. What to do?
1. Understand problem, define population & objectives & metrics
2. Brainstorm features to consider
3. How do you know if your feature works?
• Design of experiment (metrics, assignment)
• Duration & exposure of your experiment. 1point 3 acres
• How would you make decision?. 1point 3acres
What if you see xyz?
.1point3acres



















 狗仔卡
狗仔卡

 收藏
收藏 淘帖
淘帖 好苗
好苗 杂草
杂草


 提升卡
提升卡 置顶卡
置顶卡 关贴卡
关贴卡 开贴卡
开贴卡 变色卡
变色卡 千斤顶
千斤顶